Earthquake Source Models

Earthquake deformation field provided by Stephen Kirby of the USGS (Figure 1). The source was defined by 64 sub faults, each approximately 25 x 50 km for a total fault plane area of 400 x 200 km. The sources featured variable slip amounts and dip angles. Rake was assumed to be pure dip-slip while strike angle varied across the segments to maintain alignment with the trench bathymetry. The rock rigidity values also varied with harder material at depth (50 GPa) and softer material near the surface (30 GPa).
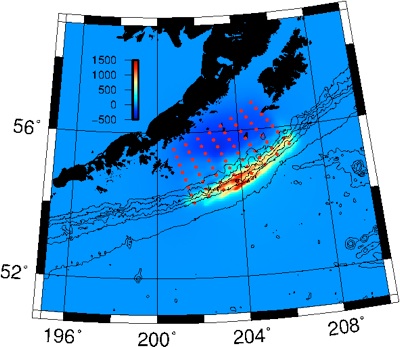
Figure 1: Plot of deformation data provided by USGS. Sub-fault epicentres are indicated by the red dots.
To calibrate the initial condition for implementation in to the MOST model, we used the sub fault information provided by USGS to initialise MOST version of the Okada (1985) elastic dislocation model. Figure 2 shows the output from that exercise and suggest that this particular version of the elastic deformation model gives similar result to the defined source scenario.
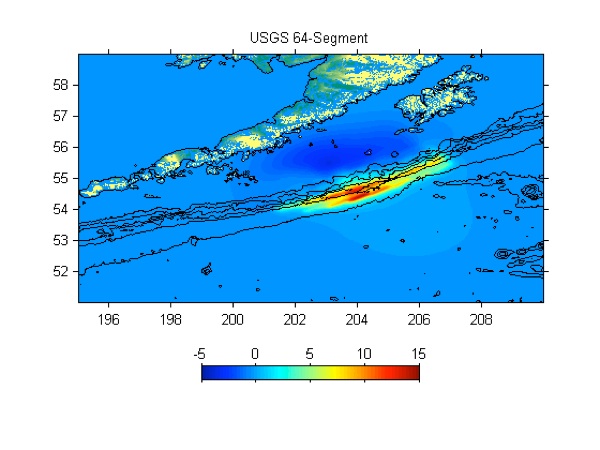
Figure 2 Surface displacement computed by the MOST version of Okada's (1985) elastic dislocation model.
For this study, we chose to adapt the 64 segment model into the sub fault geometry available to users of the MOST tsunami inundation model via the ComMIT model interface (Titov et al., 2010).
The ComMIT interface allows for the linear scaling and superposition of deep ocean tsunami propagation model results generated by a unit displacement on a range of 100 x 50 km sub faults defined along the subduction zones of the Pacific Rim. An example of this fault segment discretization over the source region is shown in Figure 3.
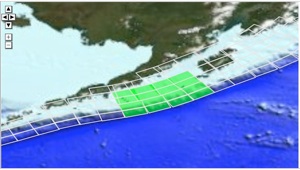
Figure 3. The subfault segments that most closely match the source region defined for this study. Sources are numbered 28 - 31 for rows Y, Z, A and B.
To implement the source model into the ComMIT model, the 64-segment source model (average slip = 18.63 m) was averaged into 4 segment clusters as indicated Table 1. The average of each four segment cluster was then used as the slip over each of the 100 km x 50 km sub faults available to the ComMIT model. Slip amounts are indicated in Table 2. The elastic deformation model was then used to compute the corresponding sea floor deformation (Figure 4).
Table 1: Slip amount (m) on each subfault segment of the original source model. Average slip is 18.6 m. The average slip over the 4 segments highlighted in red is 53 m.
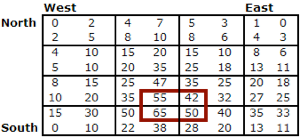
Table 2. A 16 segment subfault comprised of 4-segment average slip amounts from the 64-segment model. Average slip = 18.5 m
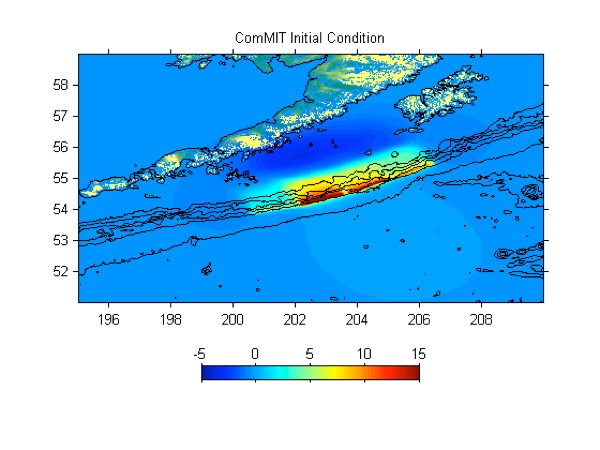
Figure 4. Surface deformation cause by a 16-segment fault model derived from 4-segment averages of the 64-segment fault model.
It is is apparent that the deformation predicted by this representation of the slip distribution is somewhat different than the 64-segment model. However, the magnitude and areal extent of the uplift and subsidence regions are comparable. In an effort to 'fine tune' the source to fit the deformation pattern produced by the 64-segment model, we used an ad-hoc, trial and error approach to distribute slip across the segments with the goal of maintaining the overall average slip. In this process we noted that choosing the four segments highlighted with the red outline in Table 1, yields an average slip of 53 m, which is larger than the average of any other grouping of four segments. We used this number simply as guidance as to what the highest allowable slip amount would be on one segment of the 16-fault model.
While there are virtually an infinite number of possible slip distributions, we eventually chose one that somewhat approximates the deformation pattern indicated in the original 64-segment approach.
The primary difference between the 16-segment and 64-segment fault models is the location of the maximum displacement relative to the trench axis. The more detailed 64-segment approach is able to push the deformation towards the south east and in to deeper water than is possible with the constraints imposed by the unit source geometry used in the ComMIT modelling approach.
Despite these differences, we do not expect there to be a large discrepancy in the computed tsunami results in Southern California for the two approaches. The sensitivity of the model results to the different initial conditions will be explored later.
Table 3. An ad-hoc, trial and error, modified version of the 16 segment fault model. Average slip = 18.6 m.
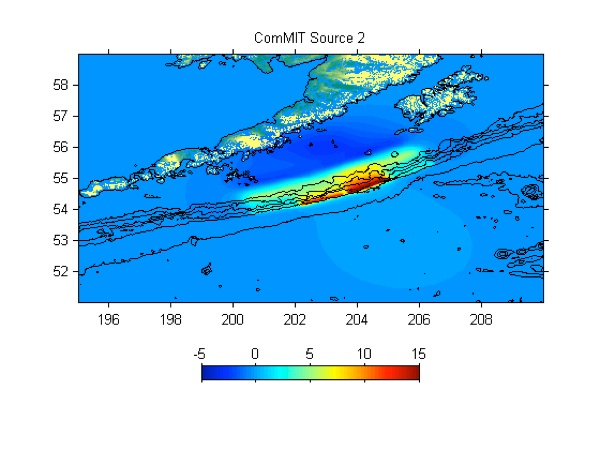
Figure 5. Computed surface deformation created by an alternate version of the 16-segment fault model.


Table 4: Fault Parameters for the 16 segment source based on the NOAA-ComMIT propagation database.